Hi! My name is
I specialize in handling spatial data and visualizing it in beautiful and insightful ways.
Work Experience
GHGSat
Operations Technician
Developer & data processor working in operations to quantify methane and carbon dioxide source rates derived from satellite imagery.
- Process daily greenhouse gas data collected from satelite and aircraft instruments.
- Develop and maintain scripts to ensure consistent and accurate data processing accross team members.
- Aid in the development of a web app for data processing.

Concordia University
Web Developer
Web developer for the Geomedia Lab under Ph.D. candidate Léa Denieul Pinsky.
This project is live at https://geomedialab.github.io/Kanehsatake-Land-Defense/
Primary focus on creating an interactive map displaying Léa's research involving temporal components and query functionality inviting the user to interact with the data to learn about land disposession in the Kanehsatà:ke region.
Tech Stack

Projects
Gatineau Park 3D Map
After moving to Ottawa, I spent a lot of time in and around Gatineau Park as my main escape to nature. One day after a 40 km bike ride I was particularly proud
of I was curious to know how much of the park I had seen, and how much of the elevation I had managed to climb.
I put together this 3D-esque map of the park in Blender after mosaicking DTMs, applying some pretty symbology based on elevation, and adding basemap elements
before exporting to Blender to play with lighting effects, attempting to recreate a sunset glow I've been lucky enough to experience on my way home from my
bike rides through this beautiful park.
Nopiming Wildfire Smoke Visualization
In June 2025, my hometown of Montreal has had some of the worst air quality in the world
due to smoke
from wildfires in Quebec and Manitoba. Motivated by this (and having an excuse to stay
inside),
I made this animation to visualize near-surface smoke from the ongoing wildfire in
Nopiming Provincial Park, Manitoba.
After wressling with NOAA's HRRR-Smoke Model data, all it took was making multiple
MatPlotLib plots, and stitching them together to
show the impact of wildfire smoke far beyond the burn area.
Kanehsatà:ke Land Defense
In charge of the development of an online map allowing users to interact with the
research of
Ph.D. candidate Léa Denieul Pinsky surrounding the disposession of Mohawk land in the
area
surrounding what is today Oka, near Montreal.
This project was the winner of the Cartography and
Geographic Information Society Annual Map Design Competition and has become part
of the permanent collection of the U.S. Library of Congress
Morin Heights Joyplot Map
As a gift for my father's 60th birthday, I made a topographic map of the ski hill we
would go to every Sunday when I was growing up.
Inspired by the Joyplot style of mapping, the underlying data for this map is a
publically available LiDAR derived DEM.
After some processing in QGIS, the result is a visually appealing representation of the
topography of Morin Heights in southern Quebec.
NDVI & Harvest in Beaune, France
Interested in how NDVI of vineyards around harvest time affect the vintage, I decided to
investigate my favorite wine region of Beaune in the Burgundy region of France just
before harvest.
This project uses Landsat 9 and Sentinel-2 images to take the user through a narrative
storytelling of
the harvests in Beaune from 2017 - 2022. Using the calculated NDVI images I ask the user
to come to a conclusion
for themselves on the correlation between NDVI and a vintage's score.
The live site for this project has since been taken offline.
Canadian Terroir
Continuing my passion for wine, I created this web app to compare the aspects making
up
Canadian terroir to those of famous wine regions of the world.
I created template GeoJson objects and programatically filled the properties with
data
derived from Google Earth Engine.
I then ran a scoring algorithm comparing the terroir data for the location the user
clicked
to each famous wine region to return a similarity score.
Whichever region has the most similar terroir is displayed to the user.
A more detailed description is available in the app's 'How It Works' tab.

BC Wildfire Visualization Tool
The 2022 fire season in BC was particularly lengthy, ending only in October. With my newly acquired skills using Folium (a Leaflet wrapper for Python) I decided to make this command line tool to better visualize how different fire seasons compared to one another. The user is prompted to enter the years they would like to display and when the program finishes we have an HTML file containing an interactive Leaflet map with heatmaps for old fire seasons and heatmaps as well as markers and polygons for the current season.
Landsat Reforestation Calculation
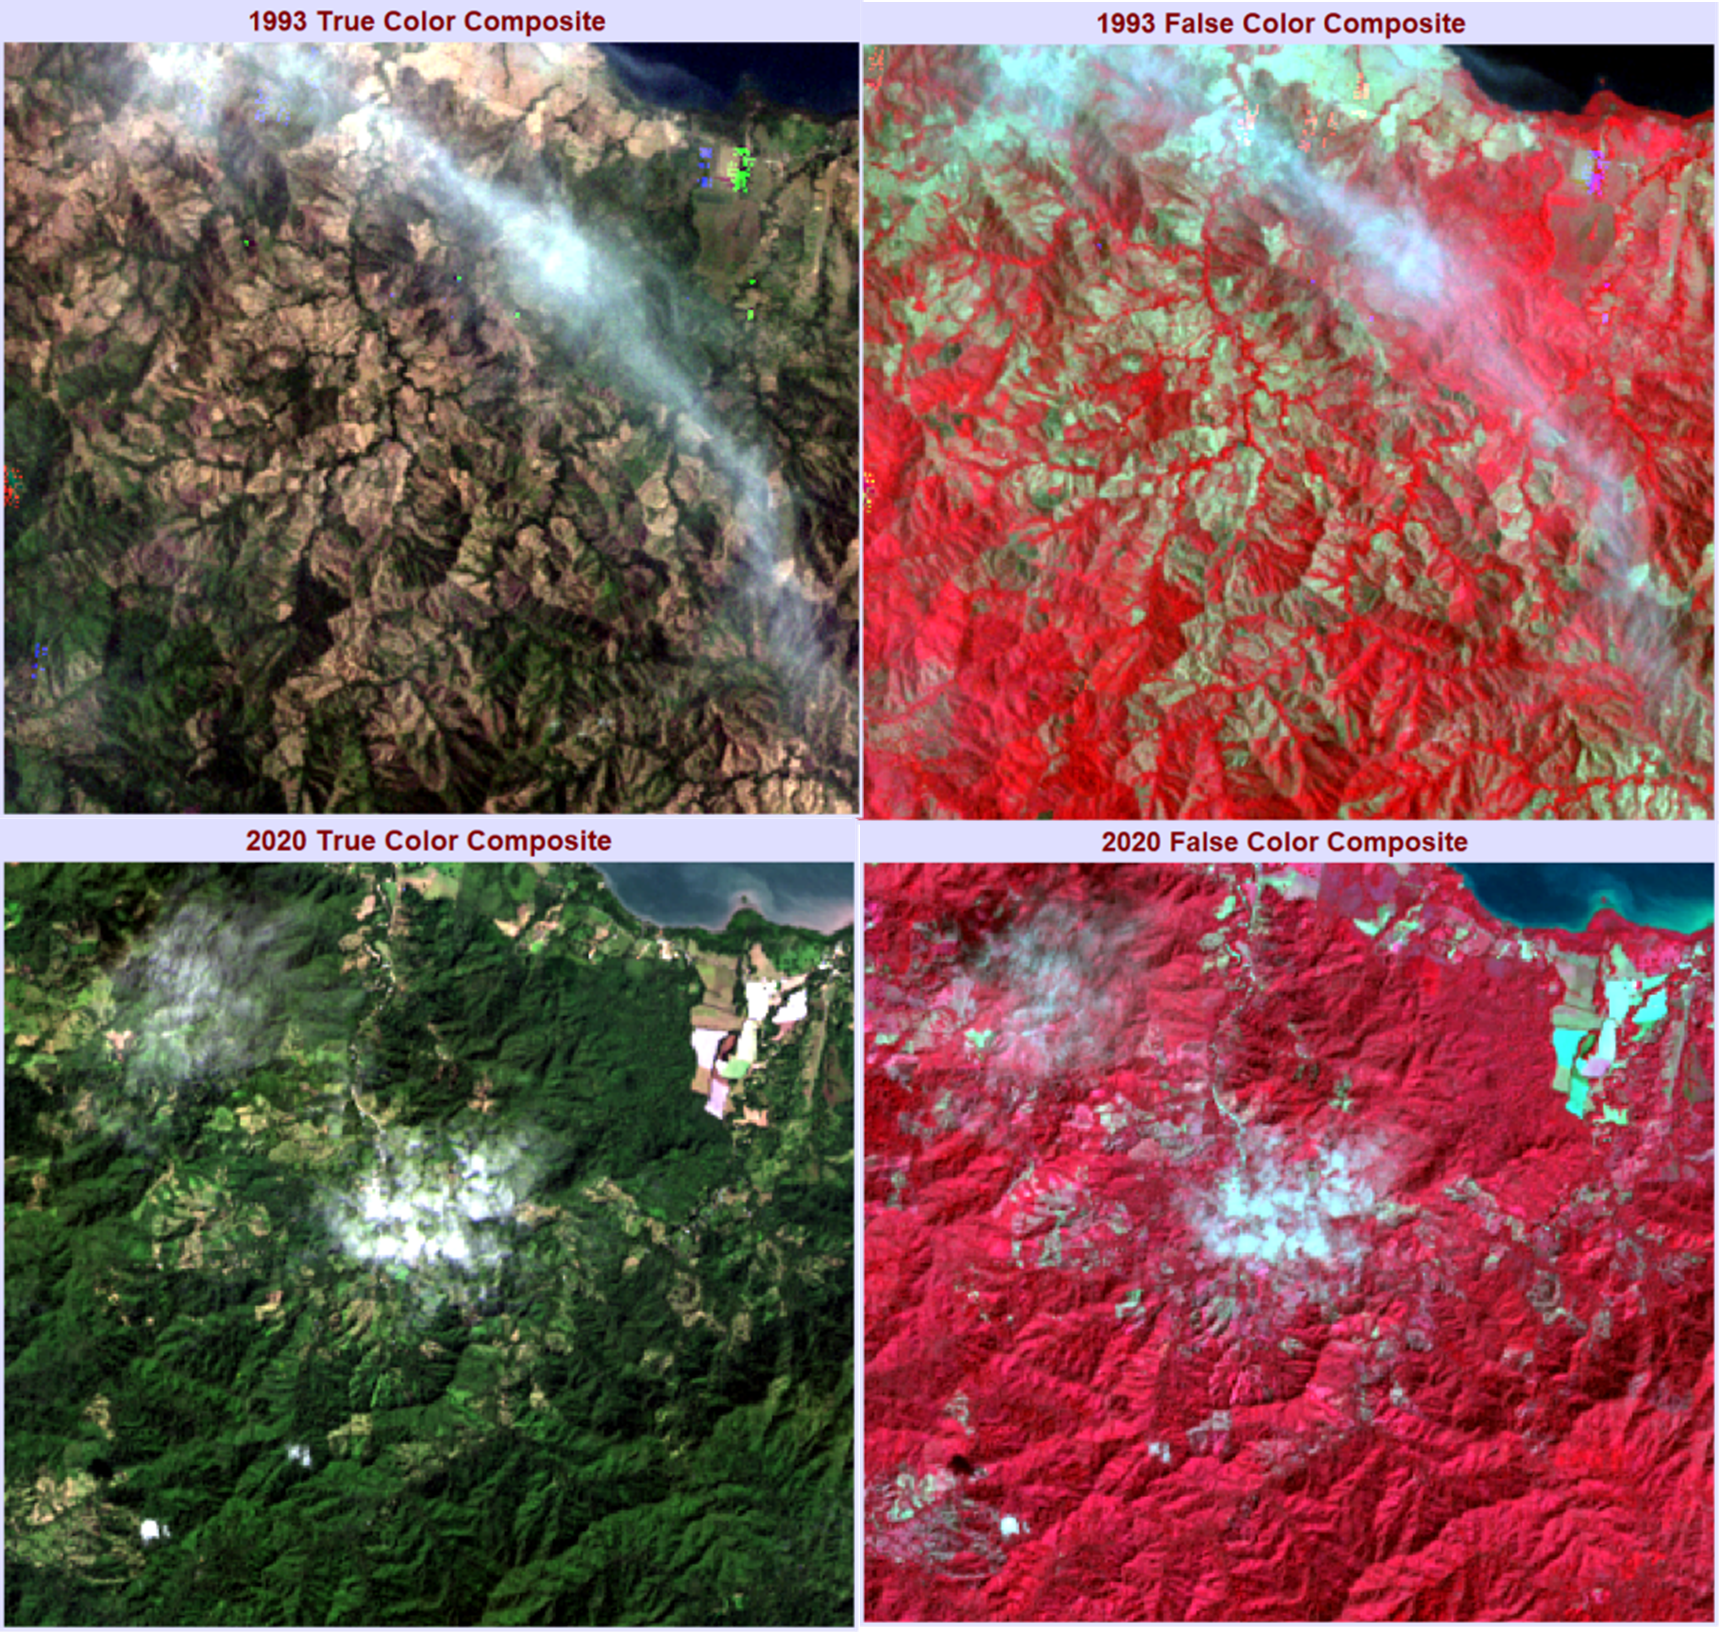
Stemming from a curiosity for how effective Payment for Ecosystem Services programs have been, my partner for this project and I used Costa Rica's PES program as a case study in land use changes affected by policy change. Utilizing Landsat 4 and 8 imagery we were able to run supervized classification schemes to visualize land use changes. Doing this in two regions and using images from two different years gives an overview of how effective the program has been.

Concordia Schedule Buddy Discord Bot
This project has been live since March 2022.
After being frustrated with the way Concordia students had to plan and create their
semester schedules, I came up with this discord bot that more cleanly
and intuitively offers information pertaining to Concordia Courses.
It uses Concordia's Open Data API to periodically update data on courses (namely
student
enrollment) and merges course data with
course prerequisite data brought in from a seperate endpoint to give students a
complete
view on their courses.